Why Quiver Exists
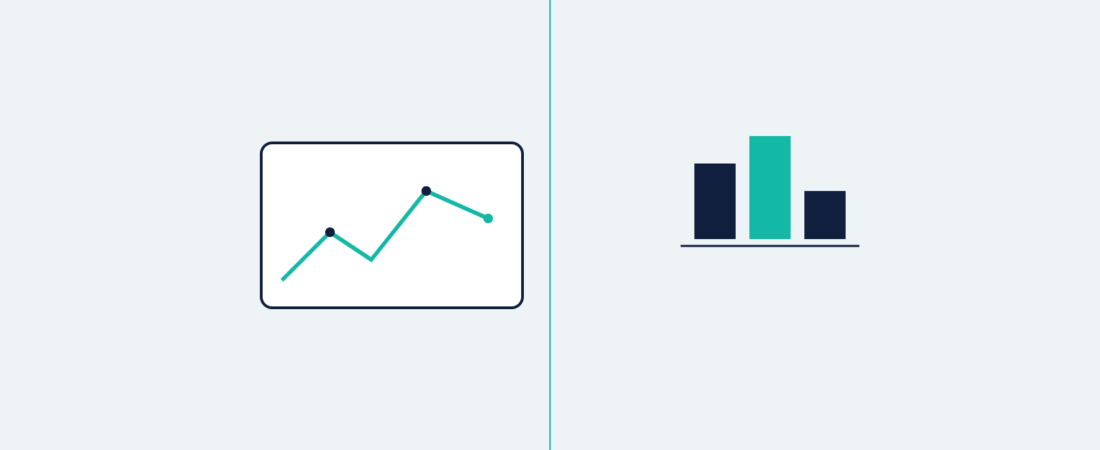
If Object Explorer is a tool for inspecting objects one at a time, Quiver is for visualizing many objects and time-series data together at once to spot patterns. It’s especially suited to data where the time axis matters — sensor readings, transactions — letting you apply operations like moving averages, interpolation, and correlation analysis as built-in functions, with no code required.
The key thing that sets Quiver apart from a typical BI tool is that it doesn’t depend on table joins. You can drag and drop your way through an object flow connected by Links — “equipment – failure history – responsible engineer” — exactly as it’s modeled.
Core Features
- Ontology-based visualization: build charts by following Object Types and Link Types directly, with no complex join queries needed.
- Time-series handling: downsample high-frequency time-series data for near-real-time rendering, with moving averages and cross-series correlation analysis available as built-in functions.
- Linked interaction: filter a range in one chart, and other charts and object sets on the same screen update together.
- Action integration: don’t just view the analysis — run an Action Type directly from the screen to record a state change.
Quiver vs. Contour
Quiver and Contour are both Ontology-based analysis and visualization tools, so they’re easy to mix up. In practice, the deciding factor is the nature of the data.
| Quiver | Contour | |
|---|---|---|
| Primary target | Time-series and event data | Structured tables and aggregate data |
| Strength | Time-based patterns, multi-chart linking | Point-and-click aggregation, pivot-style analysis |
| Typical use | Sensor/equipment monitoring, transaction tracking | Revenue, inventory, and other structured-metric dashboards |
When either could work, Quiver fits better if change over time is the actual point of the analysis; Contour fits better if aggregation and comparison at a given point in time is the point.
Common Mistakes
- Forcing Quiver onto structured aggregation work: building something like a simple revenue rollup in Quiver, when it isn’t a time series at all, just makes something Contour’s point-and-click aggregation could handle more simply into a complicated exercise.
- Building filters separately on every screen: Quiver’s strength is that a filter on one chart carries over to the others. Not using that linkage, and building an independent filter on every chart instead, undercuts the reason to use Quiver in the first place.
- Not checking Writeback permissions before designing the screen: running an Action directly from Quiver requires permission on that Action Type. Discovering a permissions gap after the screen is fully built means a much bigger rework.
Next Steps
If you need aggregation and dashboards centered on structured data, Contour is the next stop.